Declarative campaigns
Define what to benchmark, not how. Campaigns describe benchmarks, parameter spaces, and run counts as pure data.
Describe an experiment once as a campaign: benchkit fetches, builds, runs, and collects, then turns the results into publication-ready plots.
pip install pybenchkit
from benchkit import CampaignCartesianProduct
from benchkit.benches.leveldb import LevelDBBench

campaign = CampaignCartesianProduct(
    name="leveldb_campaign",
    benchmark=LevelDBBench(),
    variables={
        "bench_name": ["readrandom", "seekrandom"],
        "nb_threads": [2, 4, 8],
    },
    nb_runs=3,
    duration_s=10,
)

campaign.run()
campaign.generate_graph(
    plot_name="lineplot",
    x="nb_threads",
    y="throughput",
    hue="bench_name",
)import re
from pathlib import Path
from benchkit.core.bktypes import RecordResult
from benchkit.core.bktypes.callresults import BuildResult, FetchResult, RunResult
from benchkit.core.bktypes.contexts import (
BuildContext, CollectContext, FetchContext, RunContext)
from benchkit.utils.dir import get_benches_dir
_COUNT_C = (Path(__file__).parent / "count.c").read_text()
class CountBench:
# A benchmark from scratch: one C file, four phases.
def fetch(self, ctx: FetchContext, parent_dir: Path | None = None) -> FetchResult:
src_dir = get_benches_dir(parent_dir, comm=ctx.platform.comm) / "count_bench"
ctx.platform.comm.makedirs(src_dir, exist_ok=True)
ctx.platform.comm.write_content_to_file(
content=_COUNT_C, output_filename=src_dir / "count.c")
return FetchResult(src_dir=src_dir)
def build(self, ctx: BuildContext) -> BuildResult:
src_dir = ctx.fetch_result.src_dir
ctx.exec(argv=["gcc", "-O2", "-o", "count", "count.c"], cwd=src_dir)
return BuildResult(build_dir=src_dir)
def run(self, ctx: RunContext) -> RunResult:
out = ctx.exec(argv=["./count", f"{ctx.duration_s}"],
cwd=ctx.build_result.build_dir)
return RunResult(outputs=[out])
def collect(self, ctx: CollectContext) -> RecordResult:
out = ctx.run_result.outputs[-1].stdout
count = re.search(r"count: (\d+)", out)
return {"count": int(count.group(1))}import re
from pathlib import Path
from benchkit.core.bktypes import RecordResult
from benchkit.core.bktypes.callresults import BuildResult, FetchResult, RunResult
from benchkit.core.bktypes.contexts import (
BuildContext, CollectContext, FetchContext, RunContext)
from benchkit.utils.buildtools import build_dir_from_ctx, cmake_build
from benchkit.utils.dir import get_benches_dir
from benchkit.utils.fetchtools import git_clone
class LevelDBBench:
# Wrap an existing project: clone, build, run its bench tool.
def fetch(self, ctx: FetchContext, parent_dir: Path | None = None) -> FetchResult:
src_dir = git_clone(
ctx=ctx,
url="https://github.com/google/leveldb.git",
commit="1.23",
parent_dir=get_benches_dir(parent_dir, comm=ctx.platform.comm),
)
ctx.exec(argv=["git", "submodule", "update", "--init", "--recursive"],
cwd=src_dir)
return FetchResult(src_dir=src_dir)
def build(self, ctx: BuildContext) -> BuildResult:
obj_dir = build_dir_from_ctx(ctx=ctx)
cmake_build(ctx=ctx, src_dir=ctx.fetch_result.src_dir,
build_dir=obj_dir, build_type="Release", target="db_bench")
return BuildResult(build_dir=obj_dir)
def run(self, ctx: RunContext, bench_name: str, nb_threads: int) -> RunResult:
out = ctx.exec(
argv=["./db_bench", f"--benchmarks={bench_name}",
f"--threads={nb_threads}"],
cwd=ctx.build_result.build_dir)
return RunResult(outputs=[out])
def collect(self, ctx: CollectContext, bench_name: str) -> RecordResult:
out = ctx.run_result.outputs[-1].stdout
stats = re.search(rf"{bench_name}\s*:\s*([\d.]+) micros/op", out)
return {"micros_per_op": float(stats.group(1))}Overview
benchkit is a declarative framework for composable performance evaluation of system software. Instead of the ad-hoc shell scripts that performance studies typically accumulate, an experiment is described once as a campaign, and the framework automates the full fetch, build, run, and collect pipeline. Benchmarks, system mechanisms, and profilers are composed as reusable components, so the same experiment description runs reproducibly and unattended across machines and architectures, and produces self-documenting result directories.
benchkit ships integrations for standard benchmarks (SPEC CPU 2017 and 2026, LevelDB, RocksDB, KyotoCabinet, microbenchmarks) and makes it straightforward to add custom ones, composable system mechanisms (lock interposition, user-space scheduling, CPU placement), and profiling tools (perf stat, perf record, differential flame graphs, and paper-quality plots).
Features
Define what to benchmark, not how. Campaigns describe benchmarks, parameter spaces, and run counts as pure data.
Layer mechanisms freely: taskset pinning, perf profiling, custom schedulers. Each wrapper is independent and reusable.
The same campaign runs on x86 laptops, ARM servers, and NUMA machines. A platform abstraction handles the differences.
Automatic CSV collection and graph generation: strip plots, bar charts, and flame graphs, ready for your paper.
From the paper
Every figure below comes from the ICPE 2026 paper and was generated by a benchkit campaign.
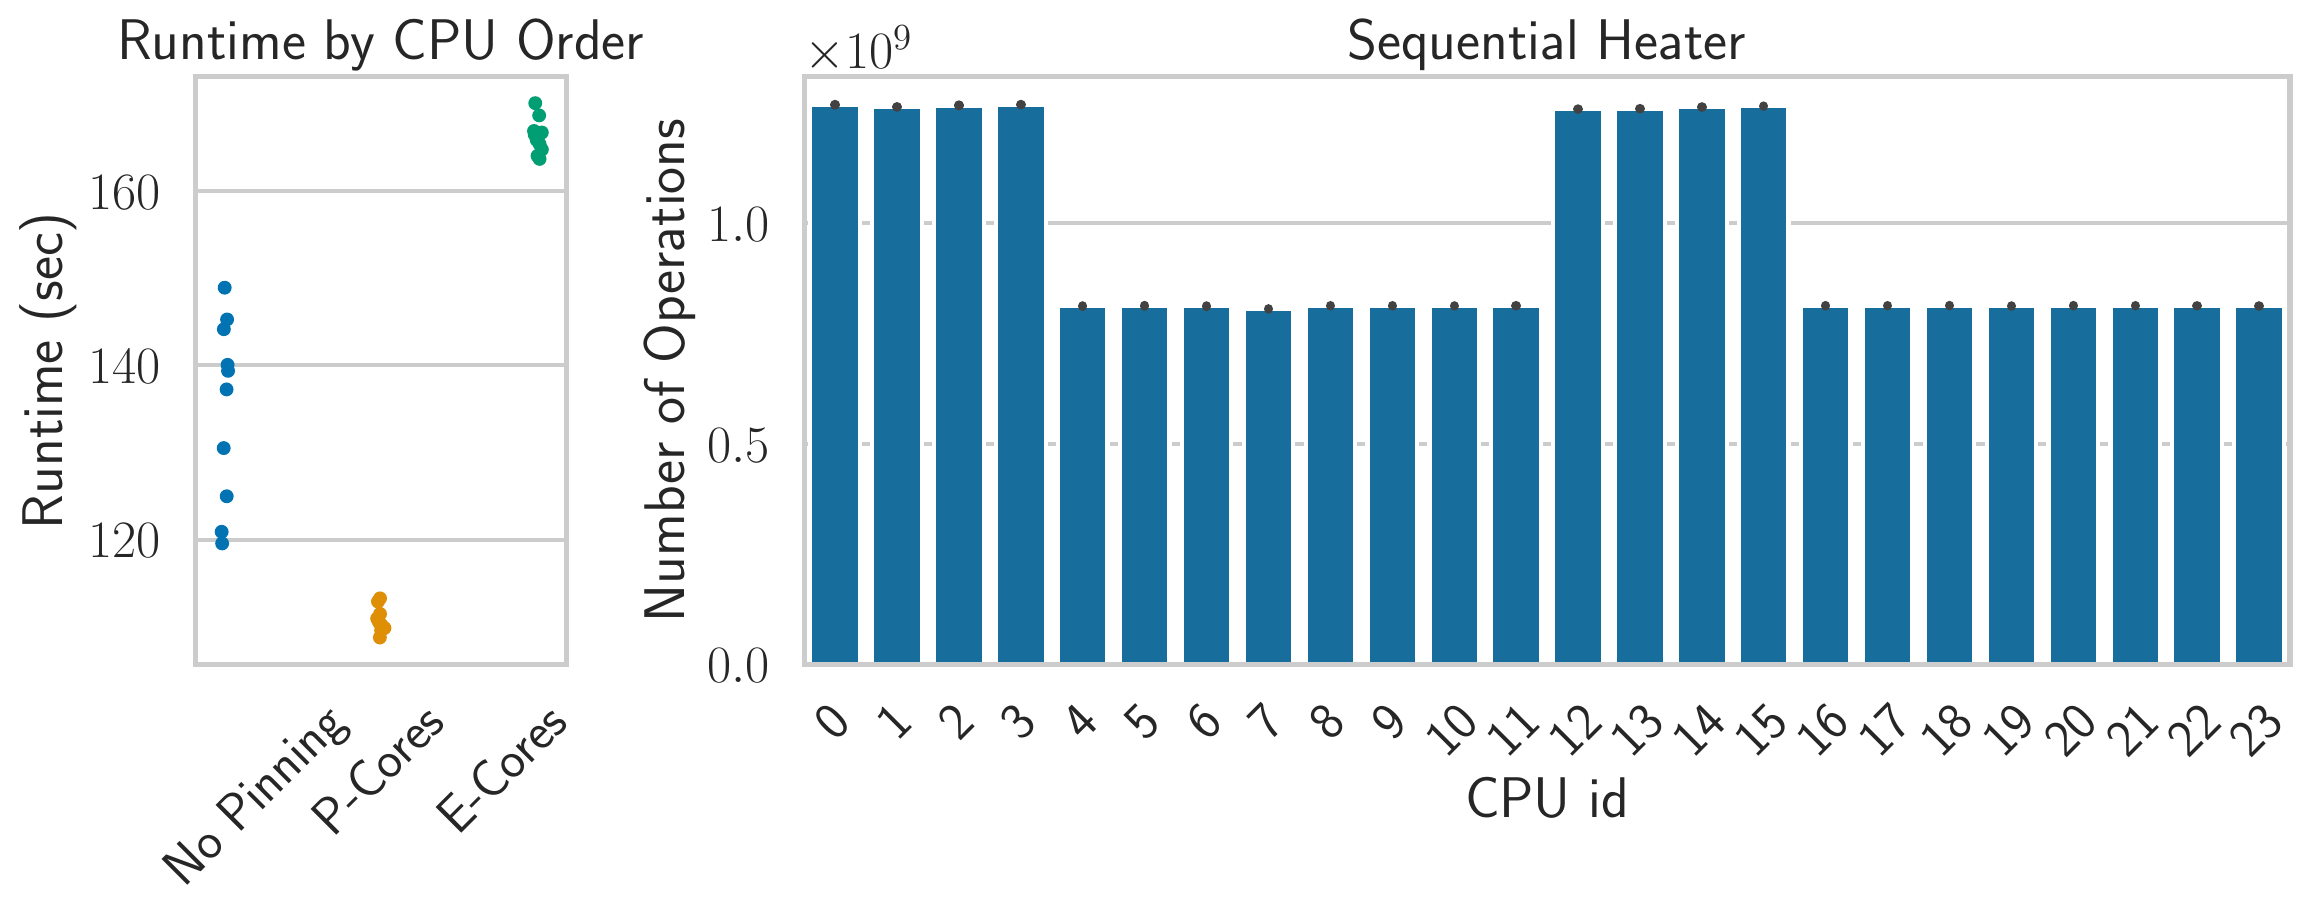
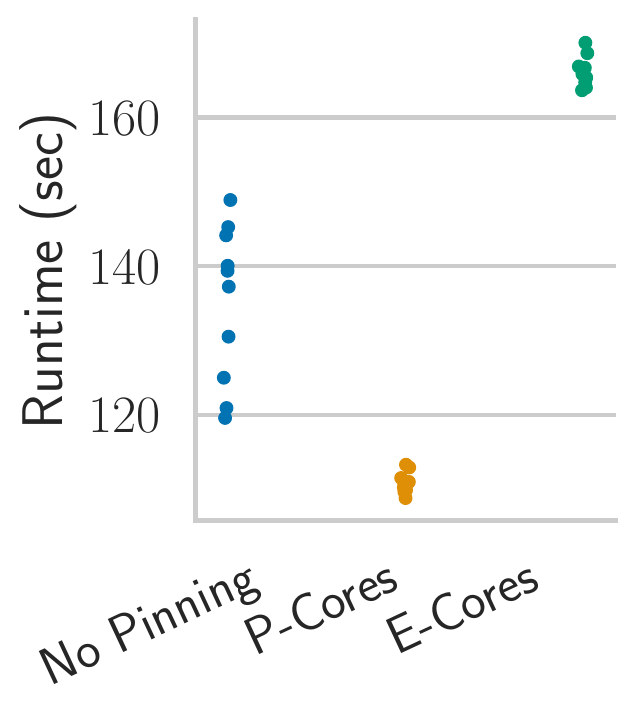
How thread-to-core pinning affects performance on hybrid-core CPUs (P-cores and E-cores).
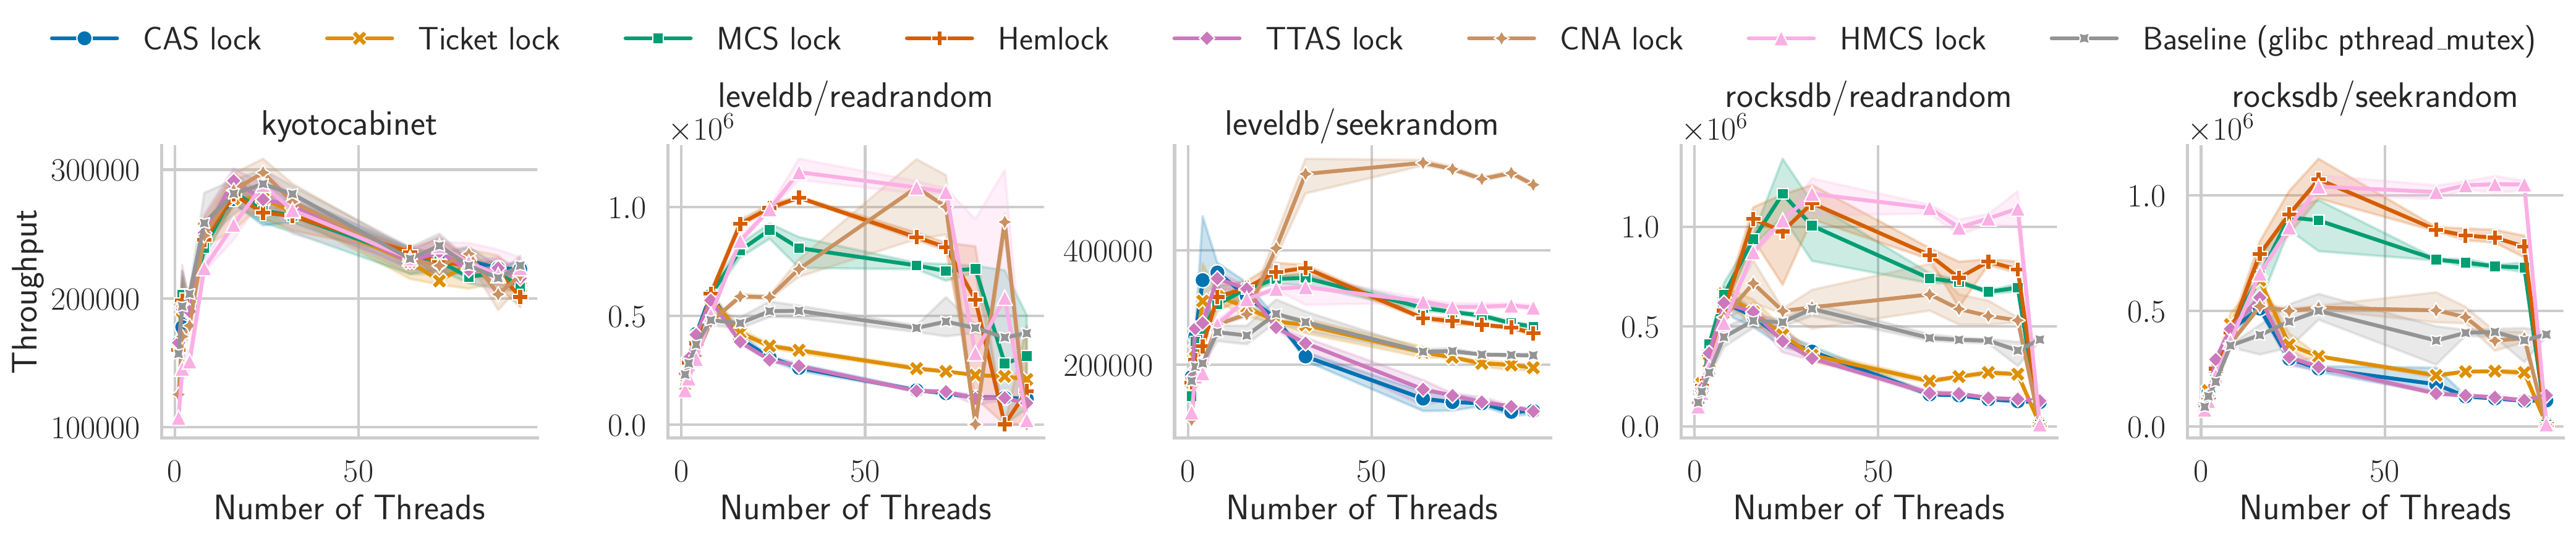
Compare pthread mutexes, CAS spinlocks, and MCS queue locks under contention via transparent library interposition (tilt).
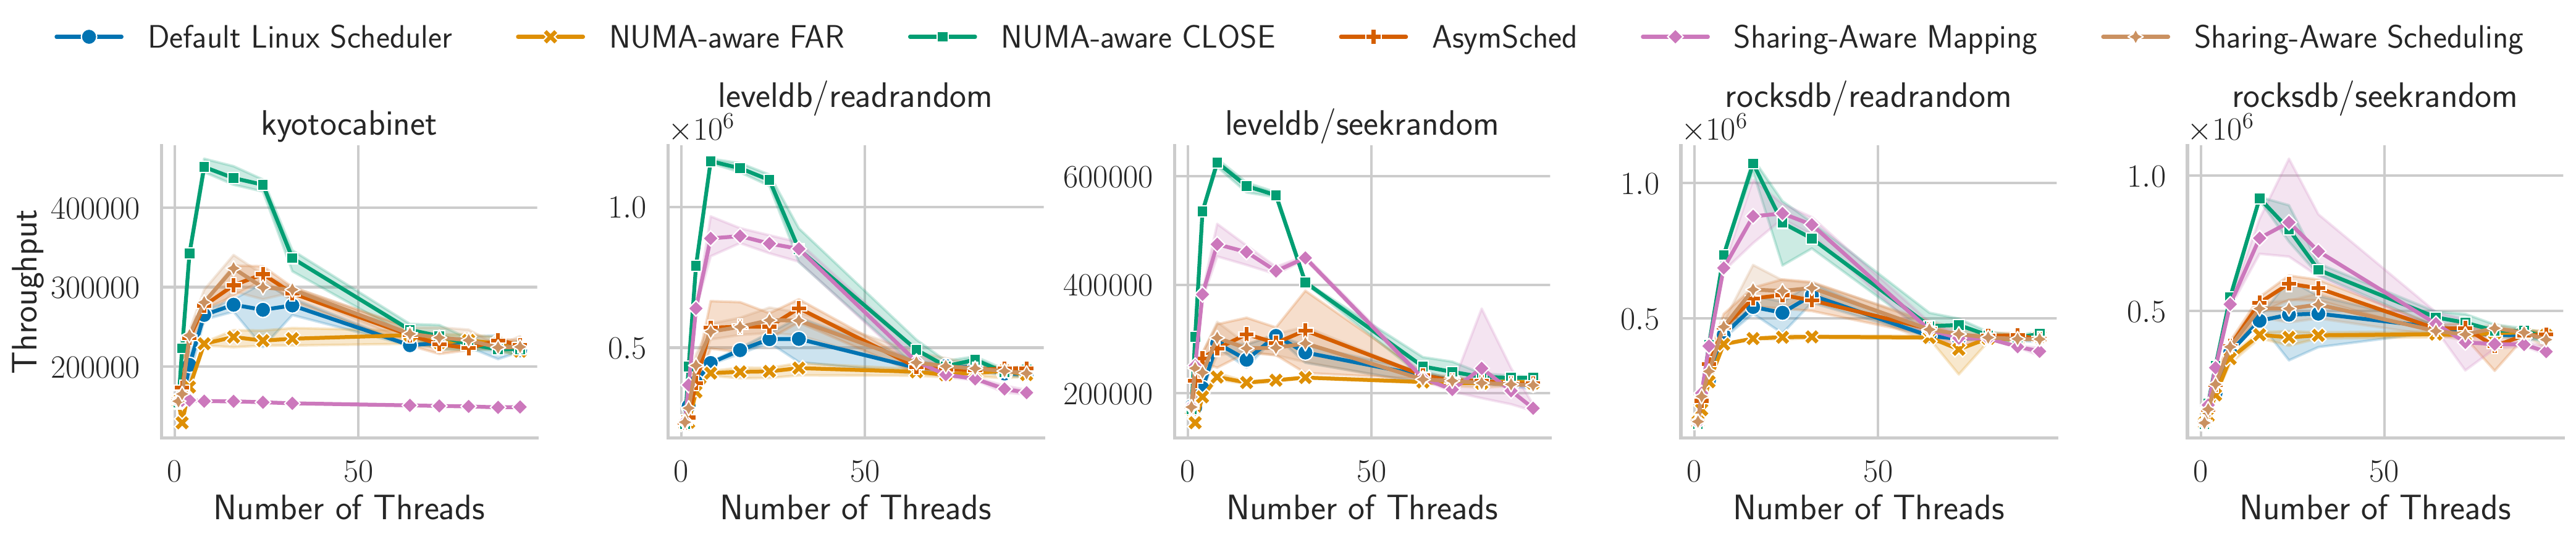
Plug in user-space schedulers via start/end hooks; benchmark policies without kernel changes (schedkit).

Wrap benchmarks with perf stat to collect cache misses, mispredictions, and IPC, merged into results.
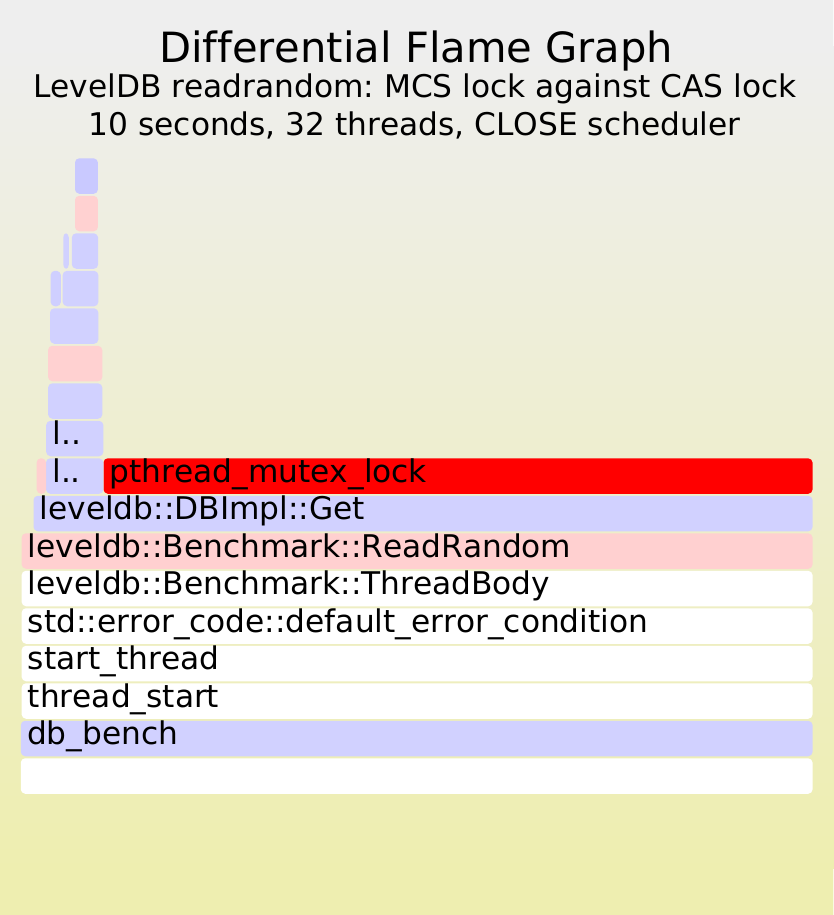
Record perf profiles and generate differential flame graphs to see where time shifts between configs.
Run industry-standard SPEC benchmarks with the same declarative API and the same wrappers.
Research
If you use benchkit in your research, consider citing the ICPE 2026 paper, by Antonio Paolillo, Mats Van Molle, and Ken Hasselmann.
The paper explains the design of the framework and walks through the six case studies shown above, from CPU placement on hybrid-core machines to differential flame graphs.
@inproceedings{Paolillo_benchkit_2026,
  author    = {Paolillo, Antonio and Van Molle, Mats and Hasselmann, Ken},
  title     = {benchkit: A Declarative Framework for Composable Performance Evaluation of System Software},
  booktitle = {Proceedings of the 17th ACM/SPEC International Conference on Performance Engineering (ICPE '26)},
  year      = {2026},
  pages     = {170--183},
  publisher = {ACM},
  doi       = {10.1145/3777884.3796997},
  url       = {https://doi.org/10.1145/3777884.3796997}
}